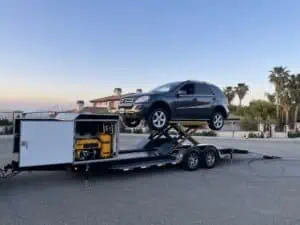
Electric Vehicle Repairs are going to change the aftermarket industry. Battery Electric Vehicles (EVs) are here to stay…at least that is the common belief; and there is good reason for it. Since launch, Tesla, for example, has rationalized its production of Model S and Model X and is ramping up its Model 3 production. Vehicle price points are gradually moving lower and the major OEMs are adding their own models to the mix with virtually every OEM planning extensive portfolios of EVs. It is just a matter of time before EV’s achieve price parity with internal combustion engine (ICE) vehicles.
I for one, in spite of spending the majority of my career in the petroleum industry, see this as positive. Opinions aside, what does this mean in the long term for the industry and in particular, what does this mean for the after-service industry? At 3ng Consulting the after-service industry is our primary interest; it’s why we developed the Fixed Ops Triad approach. Naturally we wanted to look at how the growth of EVs would affect the service industry in the long term. So, we developed a model to estimate the long-term effects of EV population growth on the vehicle after service industry. Here’s what we determined.
Estimating EV Share of Vehicles in Operation – 2040
1. Projecting sales of EV’s into the future
a. After reviewing several sources, we choose the middle estimate from the model created by Bloomberg New Energy Finance (BNEF) which predicts that EV sales in the US will be approximately 54% in 2040.
2. Predicting service needs
a. We applied the BNEF model to the current service market using total Units in Operation (UIO)
i. From this, we estimated the sales market share of both EVs and ICE vehicles – including light trucks – on a yearly basis out to 2040.
b. Using this model, we applied the following assumptions
i. Flat sales over the entire study horizon – current to 2040
ii. Population growth, EV acceptance rate, government regulations and growth of shared mobility were held constant
iii. A scrap rate for each type of vehicle
c. This allowed us to calculate both a total UIO and a total share of UIO for each type of vehicle.
3. Using steps 1 and 2, we created a baseline from which to calculate the service demand for each type of vehicle.
Calculating Dollars Spent on Vehicle Repairs
To estimate the total amount of money spent on servicing vehicles, we chose to use estimates for maintenance costs on a per mile basis.
ICE Vehicles: Using AAA and Popular Mechanics, along with our own data, we determined that $0.093/mile was a valid estimate
EV Vehicles: Information from various web sources suggests that the average service demand for electric vehicle is closer to $0.04 per mile.
Using 15,000 miles as the average number of miles driven per year (although there is some data that suggest EVs are on average 12,000 miles), we calculated that ICE vehicles require $1,400 and EV’s require $600 per year in maintenance fees. Once we determined the average per vehicle service demand, we simply applied these estimates to our calculated UIO.
Findings
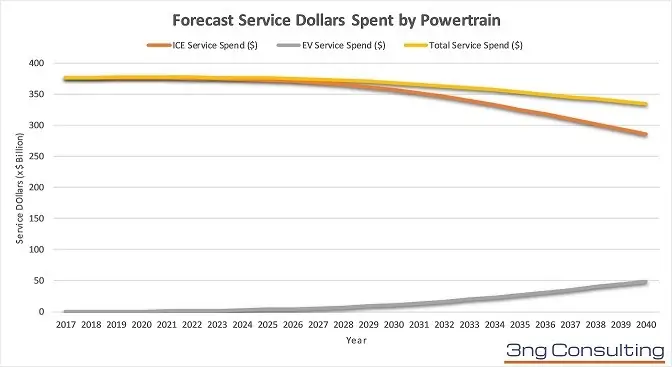
What we found was surprising. In general, and as expected, our model predicts that the amount of service dollars spent on servicing ICE vehicles decrease. However, what was surprising was that the year over year decrease is not as big as expected. The CAGR growth rate (negative) for service dollars spent on ICE vehicles thru 2040 is estimated to be -1.2%. EVs on the other hand, and as expected, will face tremendous growth in service demand, due entirely to the growth in UIO. The predicted CAGR of dollars spent servicing EVs is 27.2%. The overall growth of total service dollars spent is predicted to recede at an average rate of -0.5%. The table below shows a snapshot of our findings:
Forecast Automotive Service Dollars Spent by Driveline
Conclusion
It is clear that EV’s will increase in importance as a driver of the vehicle service economy. The increase in acceptance of EVs will spell a gradual decline in the total service market for ICE vehicles. As ICE UIO declines certain sub-system service demand will decline at a disproportionate rate. Engine components and vehicle collision parts will likely decline faster as ICE vehicles will be scrapped at a faster rate; replaced by equivalently priced EVs. Brake parts will decline due to EV’s use of regenerative braking systems. The trend is clear in the mid-term. Parts suppliers that are invested in the service business should be evaluating their strategy and developing competencies to adapt to the changing landscape. Service providers as well should begin planning for the increased influence of EVs in their business. Any strategy that ignores EVs and their effect on vehicle service demand is short sighted.


